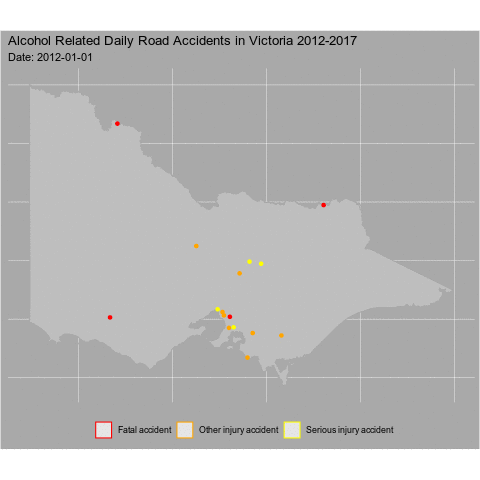
#rstats + #sf + #ggplot2 + #gganimate = a great way to visualise some sobering data. Only accidents where alcohol was involved. Remember each frame only accidents from a single day.
— Matt Johnson (@mrjoh3) July 18, 2018
See code gist https://t.co/wqEcYku2us and get data from #vicroads api https://t.co/cBX1kBz9iw pic.twitter.com/tNobkLQQQH
library(dplyr)
library(sf)
library(ggplot2)
library(gganimate)

shp <- st_read('~/Documents/Matt/GIS/shp','Crashes_Last_Five_Years', quiet = TRUE) %>%
  filter(ALCOHOL_RE == 'Yes') %>%
  mutate(date = as.Date(as.character(ACCIDENT_D), '%d/%m/%Y'))

vic <- st_read('~/Documents/Matt/GIS/shp', 'VIC_STATE_POLYGON_shp', quiet = TRUE)

plt <- ggplot() +
  geom_sf(data = vic, fill = 'grey', colour = 'darkgrey') +
  geom_sf(data = shp, aes(colour = SEVERITY)) +
  scale_color_manual(values = c('red', 'orange' ,'yellow')) +
  guides(colour = guide_legend('')) +
  theme(axis.title.x=element_blank(),
        axis.text.x=element_blank(),
        axis.ticks.x=element_blank(),
        axis.title.y=element_blank(),
        axis.text.y=element_blank(),
        axis.ticks.y=element_blank(),
        panel.background = element_rect(fill = "darkgrey", colour = "darkgrey"),
        plot.background = element_rect(fill = "darkgrey"),
        legend.position = "bottom",
        legend.background = element_rect(fill = "darkgrey"),
        legend.key = element_rect(fill = "darkgrey", colour = "darkgrey")) +
  labs(title = 'Alcohol Related Daily Road Accidents in Victoria 2012-2017',
       subtitle = 'Date: {frame_time}') +
  transition_time(date) +
  ease_aes('linear')
Share this post
Twitter
Google+
Facebook
Reddit
LinkedIn
StumbleUpon
Pinterest
Email