The c3 package is a wrapper, or htmlwidget, for the C3 javascript charting library by Masayuki Tanaka. You will find this package useful if you are wanting to create a chart using R and embedding it in a Rmarkdown document or Shiny App.
The C3 library is very versatile and includes a lot of options. Currently this package wraps most of the C3 options object.
Basic Usage
The c3 package is intended to be as simple and lightweight as possible. As a starting point the data input must be a data.frame or tibble with several options.
Where no options are supplied a simple line plot is produced by default. Where no x-axis is defined the plots are sequential. Date x-axis can be parsed with not additional setting if in the format %Y-%m-%d (ie ‘2014-01-01’)
library(c3)

data <- data.frame(a = abs(rnorm(20) * 10),
                   b = abs(rnorm(20) * 10),
                   date = seq(as.Date("2014-01-01"), by = "month", length.out = 20))

c3(data)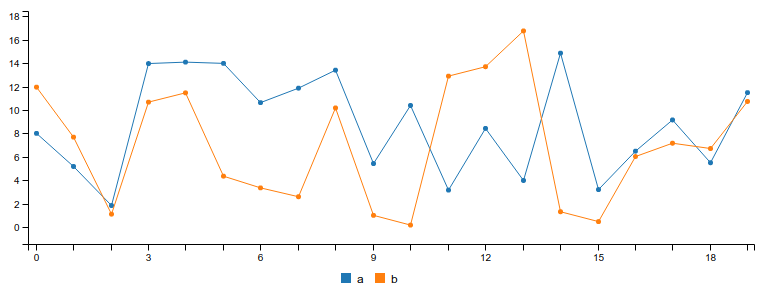
Documentation
For more detailed documentation and methods see http://mrjoh3.github.io/c3/.
